Before we start, we point out that this blog post is based on the master's thesis of Felix Hill, which you can find here. If you are generally interested in this domain, we strongly recommend giving it a read.
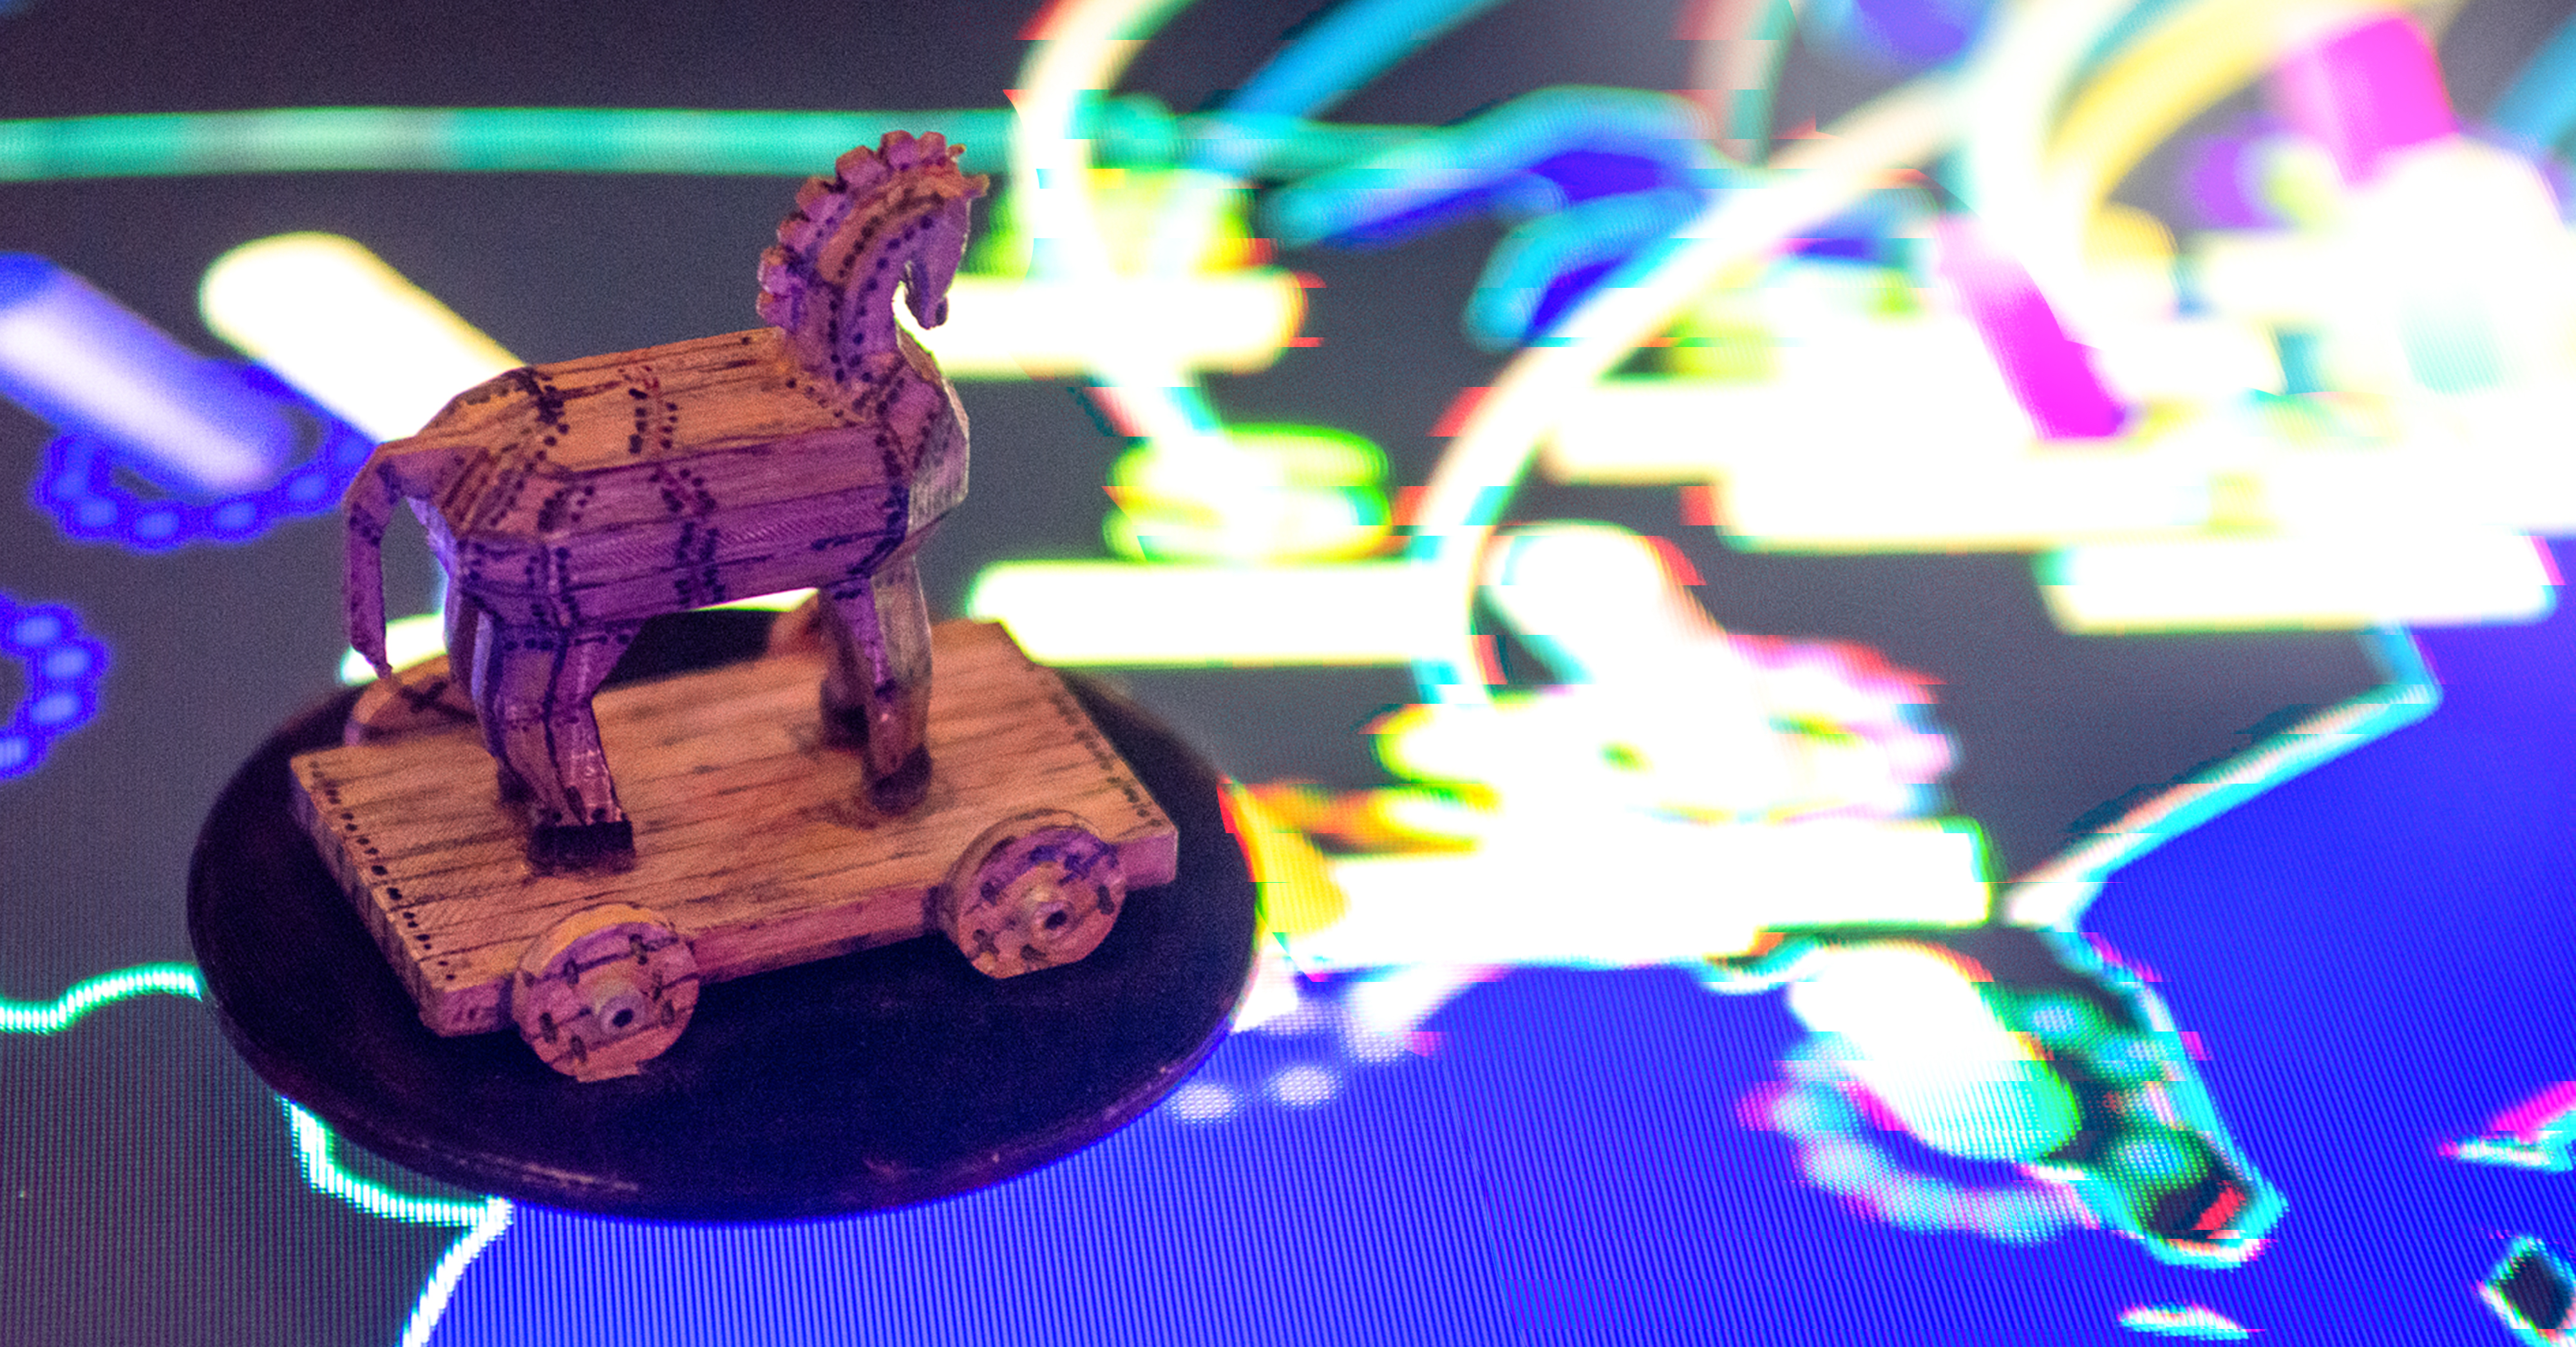
Do you recall your parents saying things like "I don't want you to hang out at..."? Maybe you have children yourself and have at some point felt the need to say that sentence (or a variation of it). Let's unveil the underlying reasoning with the help of the Figure below.
The left-hand side in the figure represents the initial situation. On the one hand there is Bob. He is a scout, hence he likes to hang out in nature. His other major passion is playing in arcades. And then there is Alice. Everyone knows that Alice is a troublemaker. After all, she wants to keep her private communication private. Therefore the vertex representing her is red. Alice also likes arcades, among other things, and she frequently visits it for longer time periods.
Since everyone - including Bob's parents - knows this, the result of this connection of Alice and trouble, everyone can associate Alice's hobbies with trouble. In consequence, the label trouble is propagated down towards the arcade vertex (compare center of Figure 1). Therefore, "Arcade" becomes an indicator for trouble. This finally can be the trigger for Bob's parents, in dire fear that he is transformed into a troublemaker at the arcade (right-hand side in the figure), so that they feel compelled to tell him what to do, or, in this case, what not to do. Otherwise, his life is probably ruined beyond repair and he ends up writing blog posts.

This article is part of a series on graph databases
In this series we take a look at how you can use a graph database in the context of malware analysis:
Classification
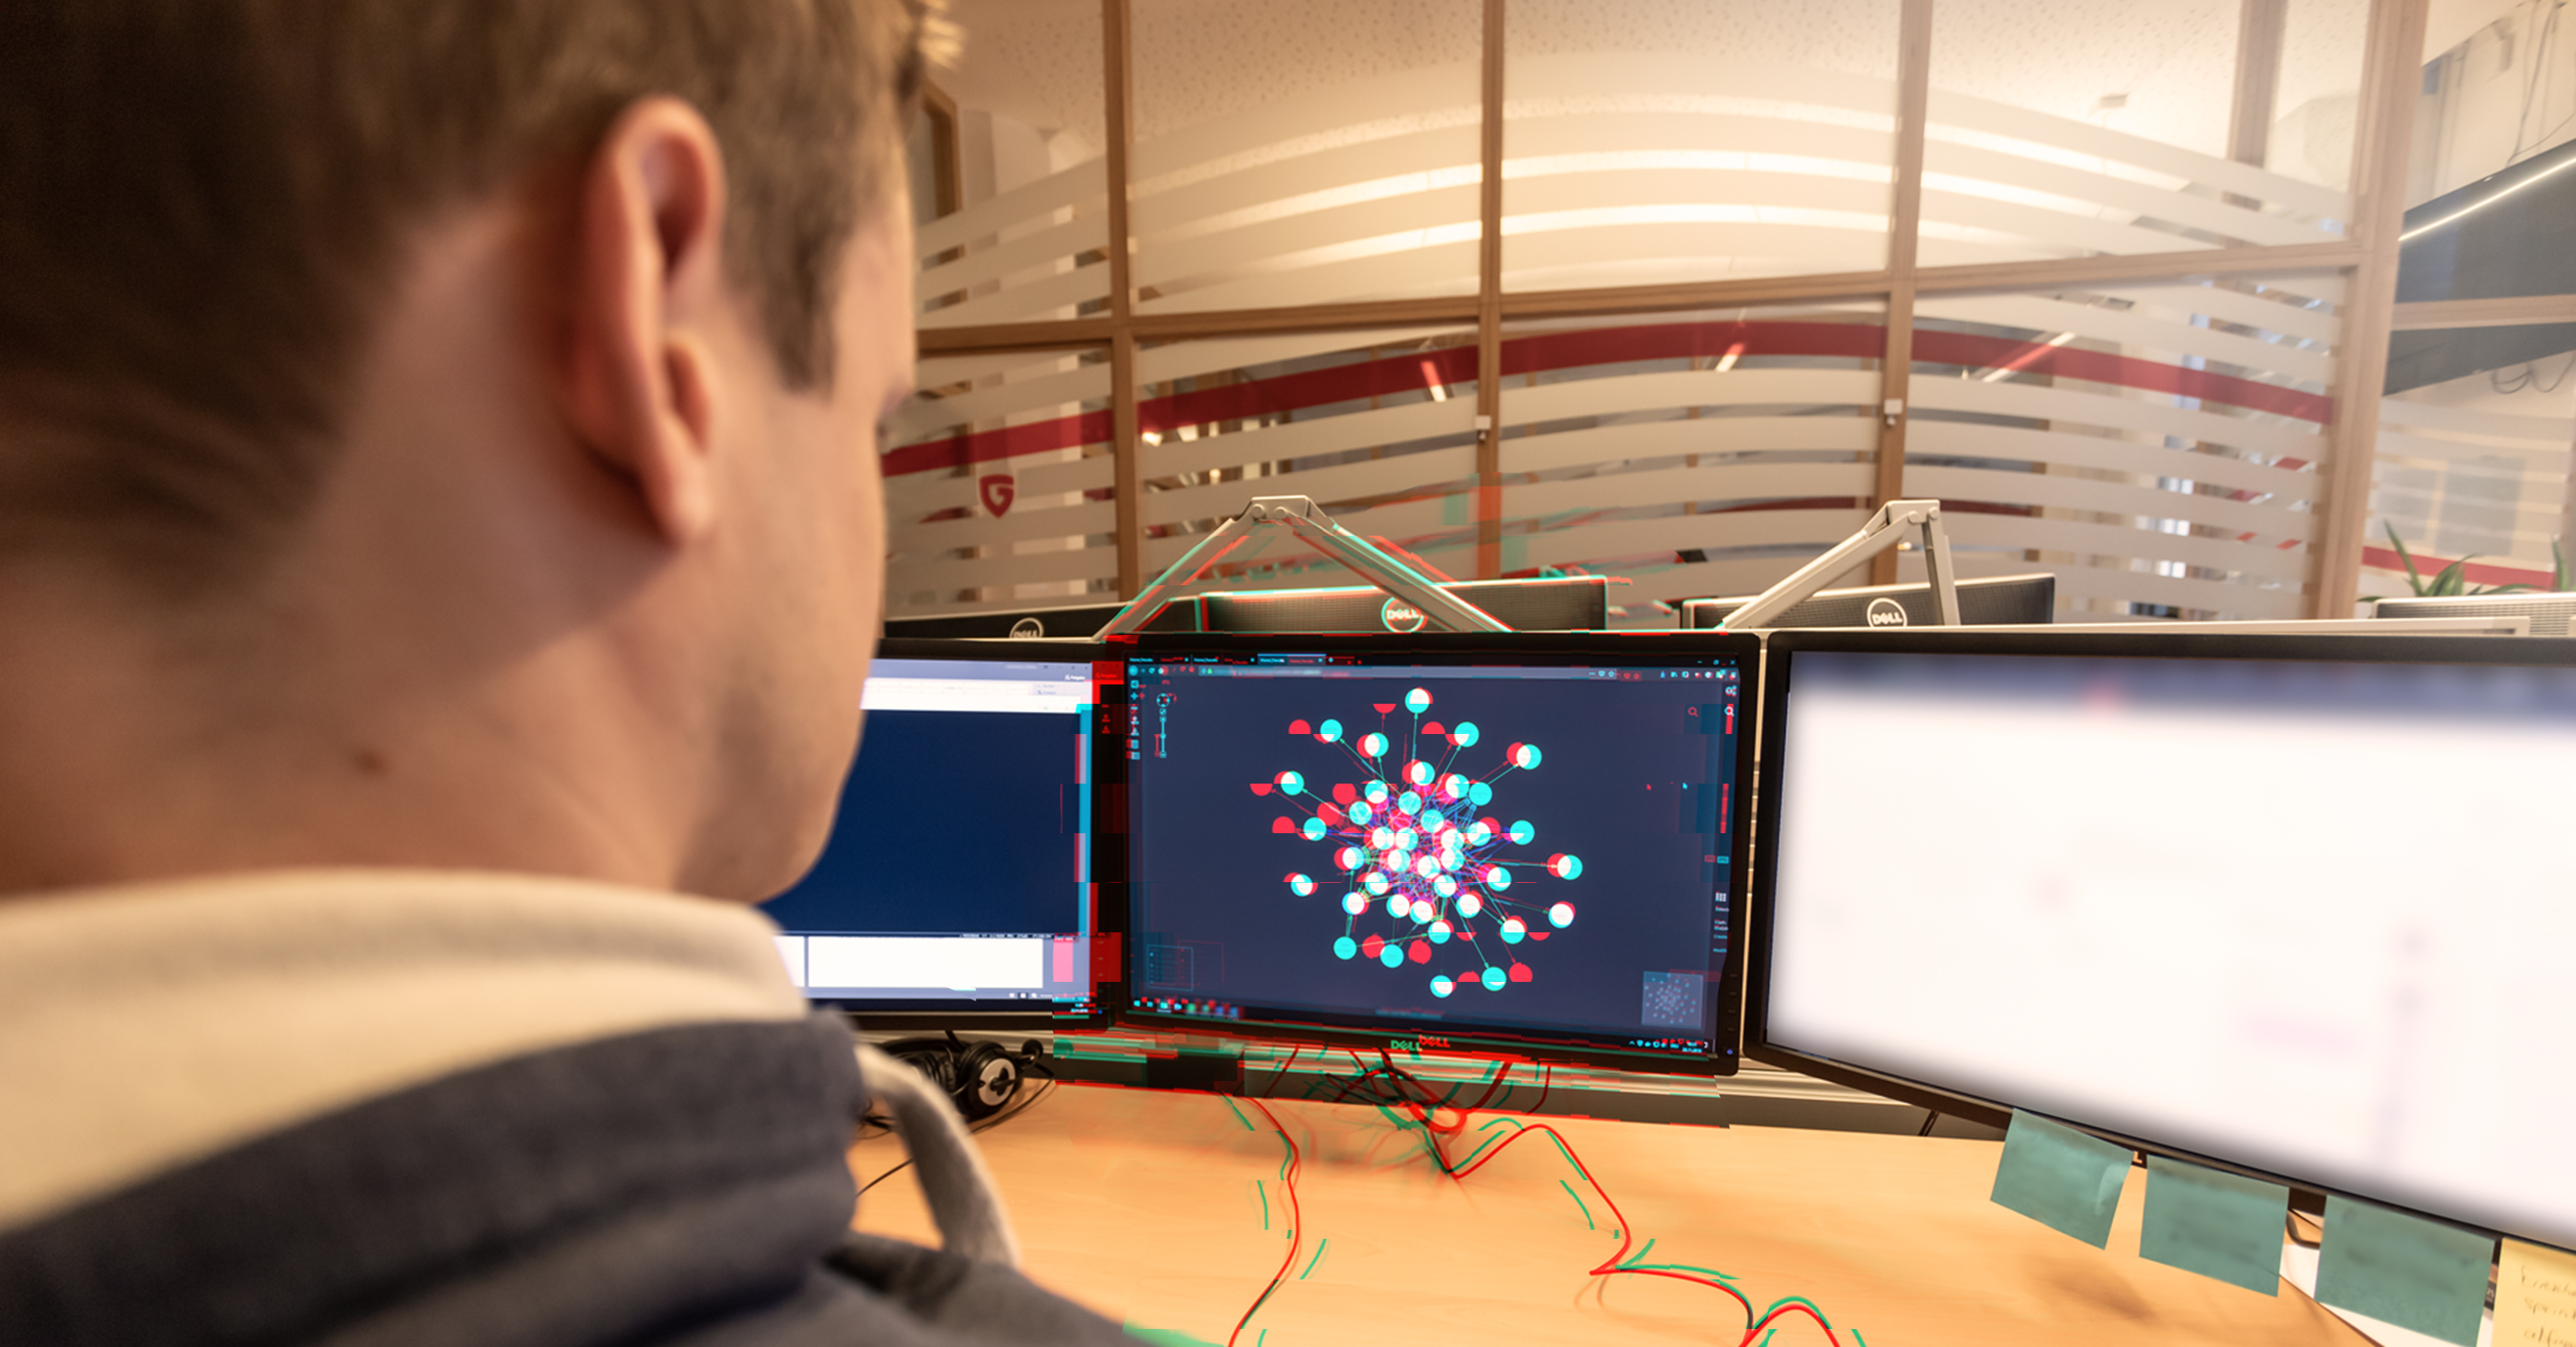
We interpret the underlying problem in the simplified introductory example as a classification problem. Admittedly, trouble is a very general form of classification. However, if we transfer the classification problem into our domain, it yields two desirable aims: it puts us in a position to determine if a sample is malicious and it allows us to draw conclusions about what malware family a sample might be associated with. We believe that our graph database is a qualified starting point to tackle these aims (see also our blog article about Malware Analysis with a Graph Database). We base our hypothesis on the fact that samples with any degree of equality are connected through common neighbors in the graph, whereby some sort of association is already in place.
Why not just use a neural network?
Generally, machine learning (ML) algorithms like neural networks perform exceptionally well in typical pattern recognition classification tasks (such as image, speech, handwriting, etc.). We reference this quickstarter to familiarize yourself with this interesting and challenging domain if you don't have any experience with this topic yet. Typically, these algorithms take multi dimensional vectors (representing one image, handwritten digit, etc.) as input.
This is where ML falls short, as we do not have such a representation in our graph. Also there is no solution to generate it, which is why we require algorithms capable of operating in a graph.
Relational-Neighbor-Classifier
Sofus A. Macskassy and Foster Provost introduced the Relational-Neighbor Classifier in this paper. Intuitively the basic mechanics of the algorithm are quite similar to the reasoning in the introductory example. In the initial state of the semi-supervised learning algorithm we assign labels to some of the vertices. In each iteration, the algorithm labels vertices that weren't initially labeled. A label is assigned based on the majority of labels present in the direct neighborhood. For the sake of completeness, we want to point out that unlabeled vertices have the label "unlabeled", which propagates to its neighbor equally. Also for completeness, we point out that the described RN-Classifier deviates slightly from the original version. These modifications are necessary to comply with our graph structure. The algorithm terminates either after a fixed number of iterations, or if there is no change in two consecutive iterations (i.e. Gi-1 = Gi, where i denotes the iteration and G the state of the graph). In any case, it is worth to re-exercise this in a toy graph.
Toygraph Example


Figure 2.1 depicts the initial state, where we initially label the samples S1, S2, and S3. The vertices F1 and F2, which both represent features of these samples, aren't labeled at all. To make this example more explicit we represent the labels through the colors of the vertices. In the first iteration, the algorithm determines if it can label F1 and F2. For F1 a final determination is not possible. If we examine the direct neighborhood of F1, then we see that there are two distinct labels, whereby the probability for each label is 0.5. Therefore, we randomly assign a label to F1 in each iteration. For simplicity, we just leave it blank and focus on F2, where the situation is much clearer. Also within the first iteration, with an examination of its neighborhood, we assign the blue label to it and finalize the first iteration. Figure 2.2 depicts this state.
In the second iteration, again ignoring F1 for simplicity, we label the remaining unlabeled vertex S4. In its neighborhood, the blue label represents the majority so that we assign it and finalize the second iteration. Figure 2.3 shows this state and represents the final result at the same time. The algorithm terminates either after a fixed number of iterations or if we randomly assign the same label to F1 in two consecutive iterations. And at the end, we classify that S4 belongs to the group represented by the blue label.
Improving the RN-Classifier
Does the algorithm succeed in Figure 3 too? No, not at all, due to the structure of the graph. If we examine the neighborhood of the ResolvedHostnames vertex in the middle, the single red label is outweighed by the majority of the two blank labels from the bottom vertices. Therefore its label never changes. In consequence, the initial RN-Classifier does not manage to propagate the red label of the vertex, representing a malware sample from a particular family. Neither to its direct neighbor nor to the compromising features the neighbor node groups together.
At this point, Felix Hill suggests his first improvement, namely splitting up the current algorithm in two phases. In both phases, we exercise the same algorithm with one modification. We use the directions of edges when examining the neighbors during the process of propagating labels. In the first phase, we propagate labels in the direction of outgoing edges. In the second phase, it is the exact opposite. Hence, we interpret the first phase as learning phase and the second phase accordingly as classification phase.
We now re-apply the modified version onto the graph in Figure 3. Within the first iteration, we are able to assign the red label to the ResolvedHostnames vertex. In the subsequent iteration, the vertices at the bottom are also labeled red. This state represents the end of the learning phase. Note that this is exactly equal to (B)in our introductory example in Figure 1, just as (C) represents the final state after the classification phase. And if we finally replace the labels in Figure 1 with labels from Figure 3, we accomplish our initial aims.
In his master's thesis, Felix Hill even further improves the classifier, to account for particular characteristics of the graph, which is why we strongly recommend it here. There are some technical aspects to be known in this context: In our example the algorithm requires a particular graph scheme. Most likely (also true in our case) your actual scheme deviates drastically from the required/desired scheme. With Apache Spark, you can transform your current graph into a state that is on one hand best suited for an algorithm, whereas implementing arbitrary algorithms as Spark VertexProgram ensures that the desired computations are carried out reliably in huge graphs.

Conclusion
In this final post of our graph database series, we directed our discussion towards a classification algorithm capable of operating in a graph. Based on the work of Felix Hill we introduced the RN-Classifier and showed that the structure of the graph is the determining factor. On the one hand, the graph structure can be changed to be a good fit for the algorithm. On the other hand, iteratively improving algorithms is also an option. Ideally, both steps are carried out so that the graph structure is a perfect match for an algorithm, yielding optimal results.
And finally, it turns out that some parents subconsciously act like machine learning algorithms (and vice versa).