Are you using Graylog and would like to handle alerts with help from Prometheus AlertManager? No problem, we got a solution for you!

It's Monday. A nice weekend you spent together with your partner is over. You get to your computer and check if your processes and services are doing well. The dashboards show that everything is healthy, but wait, what is that? 356 new e-mails. You try to figure out what happened. It is difficult because there are different services sending you e-mails with different templates.
Are you familar with such a situation? Think about an unified template for your alert e-mails. You'll see that this helps a lot in your daily business.
Our Intention
We like to use the Prometheus AlertManager which handles alerts sent by client applications (e.g. Prometheus, Grafana, ...). It is able to group alerts for you and route them to the correct receiver. The AlertManager allows you to configure your own specified template for sending alert e-mails.
We also like to use Graylog to handle our log-messages and check them for errors or failures. We tried to find an integration for AlertManager in the Graylog-Marketplace but there wasn't one where we could specify our own labels and annotations which we need for our routing and grouping. So we built one on our own and open-sourced it for everyone https://github.com/GDATASoftwareAG/Graylog-Plugin-AlertManager-Callback.
How do I get my Graylog alerts into my AlertManager?
Let's do a small example which shows how to connect a Graylog with an AlertManager by using our Graylog-AlertManager-Callback-Plugin.

Build Plugin for Graylog
First of all we need to clone and build the GitHub repository of Graylog-AlertManager-Callback plugin.
$ git clone https://github.com/GDATASoftwareAG/Graylog-Plugin-AlertManager-Callback
$ cd Graylog-Plugin-AlertManager-Callback
$ ./gradlew build
This should create a plugin JAR in build/libs/ called graylog-plugin-alertmanagercallback-<version>.jar.
Set up Graylog and AlertManager
Now we will set up Graylog and our AlertManager by using the following configuration and Docker-Compose files:
graylog.conf
# If you are running more than one instances of Graylog server you have to select one of these
# instances as master. The master will perform some periodical tasks that non-masters won't perform.
is_master = true

# The auto-generated node ID will be stored in this file and read after restarts. It is a good idea
# to use an absolute file path here if you are starting Graylog server from init scripts or similar.
node_id_file = /usr/share/graylog/data/config/node-id

# You MUST set a secret to secure/pepper the stored user passwords here. Use at least 64 characters.
# Generate one by using for example: pwgen -N 1 -s 96
password_secret = somepasswordpepper

# The default root user is named 'admin'
#root_username = admin

# You MUST specify a hash password for the root user (which you only need to initially set up the
# system and in case you lose connectivity to your authentication backend)
# This password cannot be changed using the API or via the web interface. If you need to change it,
# modify it in this file.
# Create one by using for example: echo -n yourpassword | shasum -a 256
# and put the resulting hash value into the following line
root_password_sha2 = 8c6976e5b5410415bde908bd4dee15dfb167a9c873fc4bb8a81f6f2ab448a918

# Set plugin directory here (relative or absolute)
plugin_dir = /usr/share/graylog/plugin

# REST API listen URI. Must be reachable by other Graylog server nodes if you run a cluster.
# When using Graylog Collectors, this URI will be used to receive heartbeat messages and must be accessible for all collectors.
rest_listen_uri = http://0.0.0.0/api/

# Web interface listen URI
web_listen_uri = http://0.0.0.0:9000/

# MongoDB connection string
# See https://docs.mongodb.org/manual/reference/connection-string/ for details
mongodb_uri = mongodb://mongo/graylog
docker-compose.yml
version: '2'
services:
  mongo:
    image: mongo:3

  graylog:
    image: graylog/graylog:2.5.0-1
    volumes:
      # Add the modified graylog.conf
      - ./graylog.conf:/usr/share/graylog/data/config/graylog.conf
      # Add the Graylog AlertManager-Callback plugin
      - ./graylog-plugin-alertmanagercallback-1.0.jar:/usr/share/graylog/plugin/graylog-plugin-alertmanagercallback-1.0.jar
    ports:
      # Graylog web interface and REST API
      - 9000:9000

  alertmanager:
    image: prom/alertmanager:v0.16.1
    ports:
      - 9093:9093
As you can see we map our generated plugin JAR into our Graylog container. Graylog uses the /usr/share/graylog/plugin/ directory (which is defined in the graylog.conf) to read the plugins from.
Now we need to start the compose by using:
$ docker-compose up
This will start the MongoDB, AlertManager and Graylog containers. You should now be able to connect to Graylog by visiting http://localhost:9000/. The AlertManager should be reachable at http://localhost:9093/.
Configure Graylog for Alerting
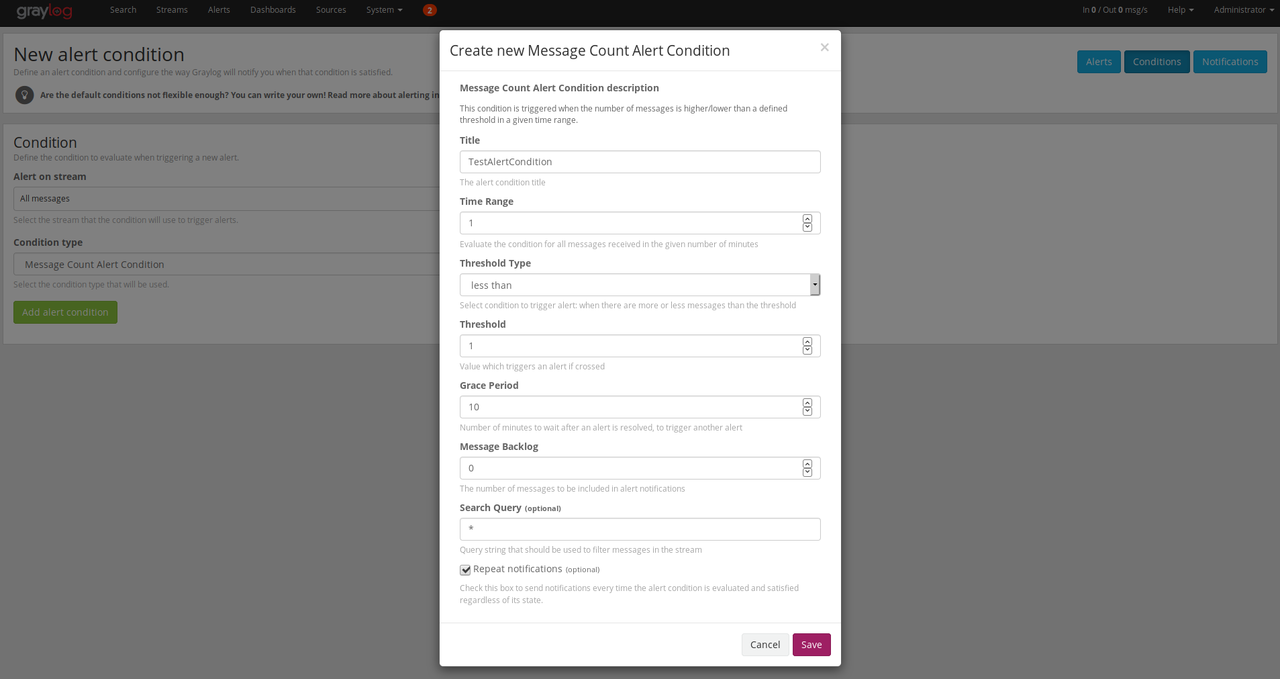
Let's configure a dummy alert condition and a notification callback in Graylog. Log in as 'admin' with the password 'admin'. Afterwards we can create the alert condition at the alert tab.
We'll configure an alert which will be fired if the 'All messages'-stream does not have at least one message within the last one minute and set a grace time to 10 minutes. At this point we don't have any message at all, so it will fire directly after the one minute has passed by.
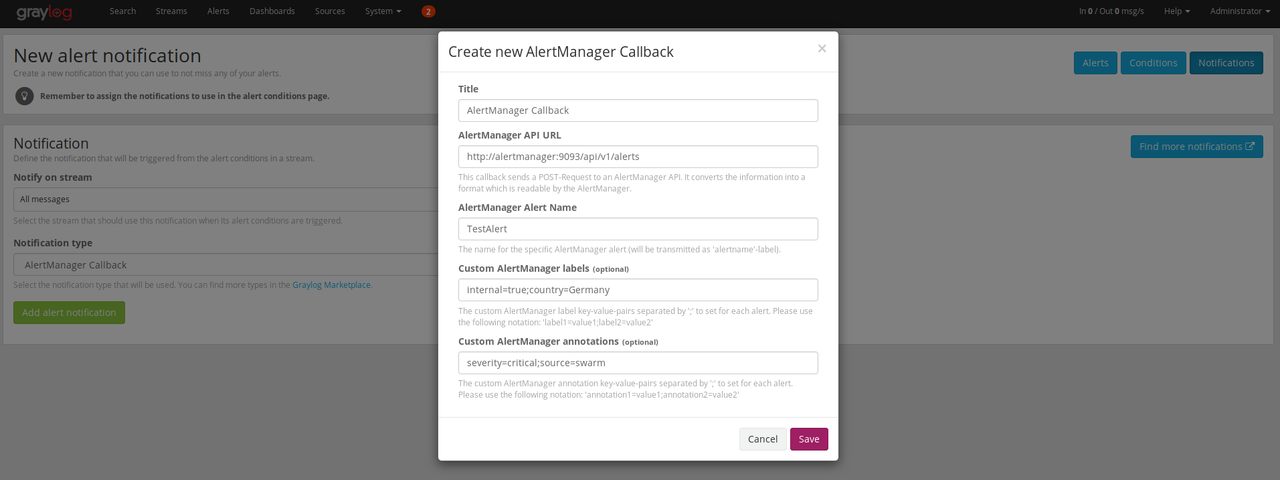
Now we need an alert notification callback. Therefore, we'll create an 'AlertManager Callback' on the 'All messages'-stream. It is important that the URL is set correctly to our AlertManager (reachable at http://alertmanager:9093/api/v1/alerts) which we've defined in our docker-compose.yml file.
Taking a look at the Alert
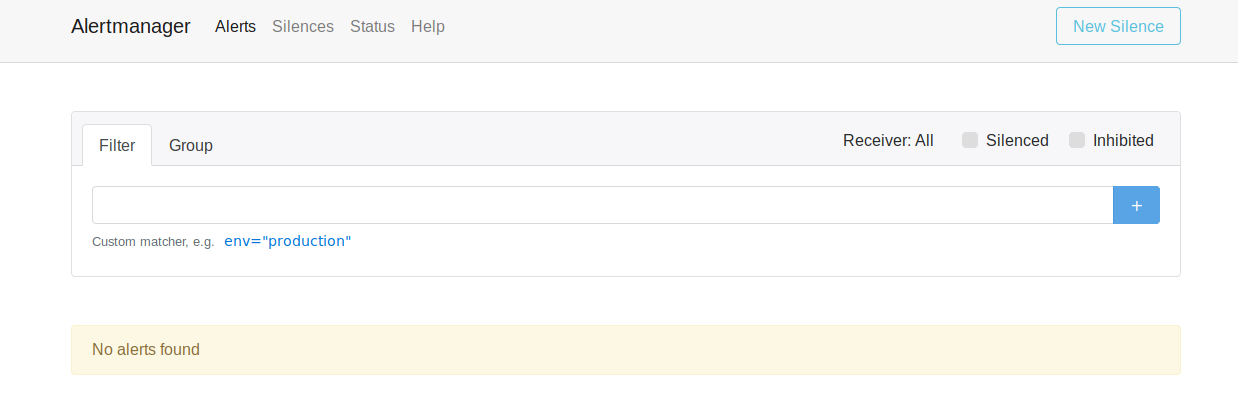
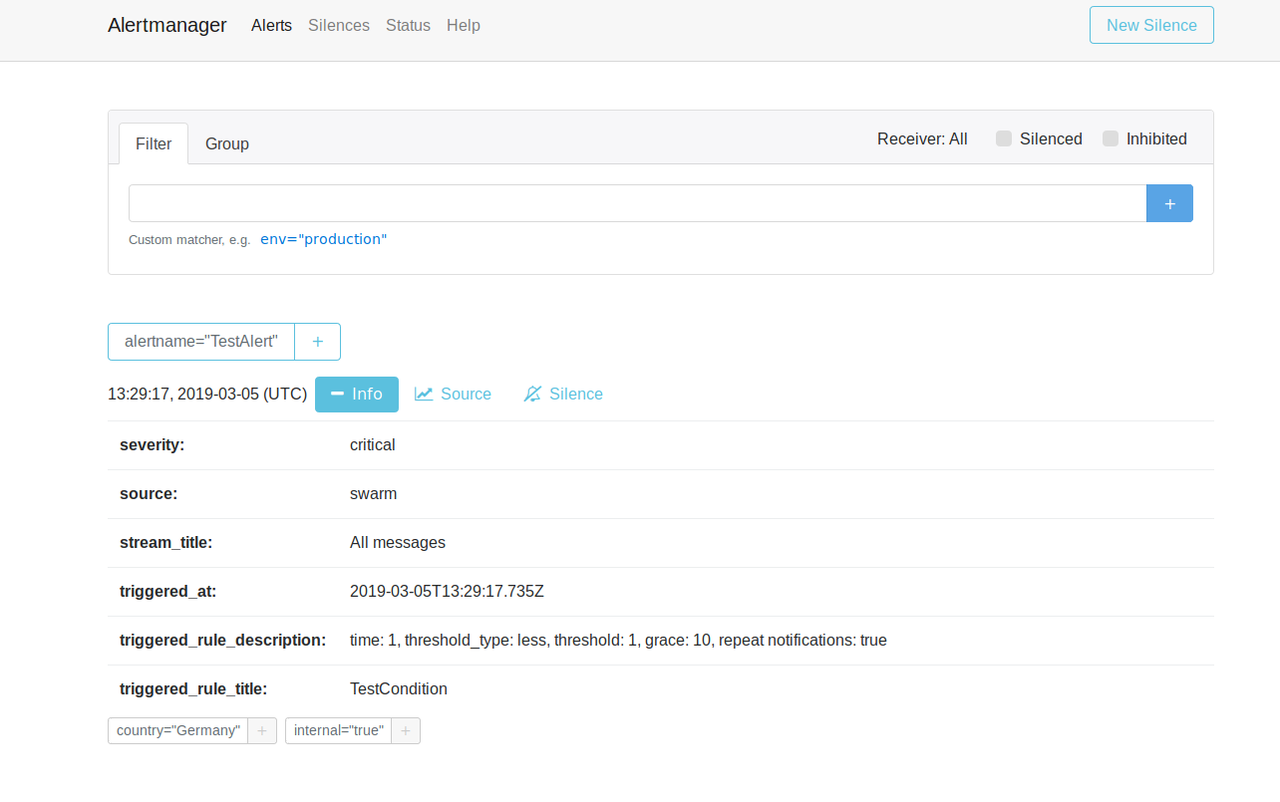
After waiting the one minute until triggering the alert condition we finally got our alert inside our AlertManager.
As you can see in the image below the callback-plugin will provide you with several information out of the box e.g. the triggered condition itself or even the stream which triggered the alert. You are able to route the alerts with such information to different recepients or handlers. You can group your alerts and filter them by those labels and annotations which are provided.
Apply your e-mail template
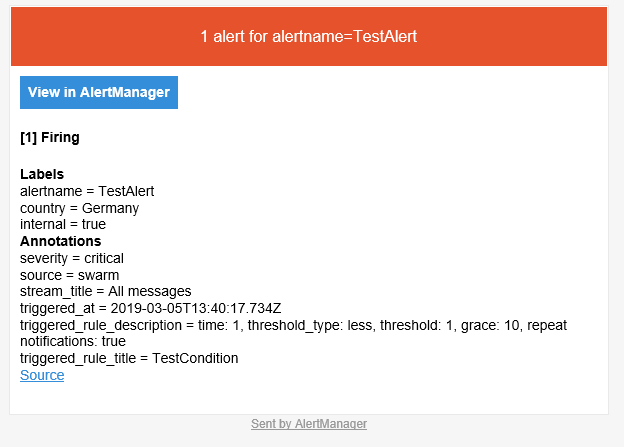
Let's put everything together: We can now define and use our own specified e-mail template which will be used by AlertManager for sending alerts via e-mail. Your are able to filter and route your alerts within the AlertManager for a better overview and an easier entry for your fire fighting / incident handling.

Stefan Decker
Senior Software Engineer